
What's New in Our Tool
Virginia Opioid Cost Data Tool Updates

Our site's previous imagery juxtaposed currency with substances in pill form. With our 2025 release, the refreshed look and feel now emphasize the site's rich data visualizations.
This tool was previously known as Cost of Addiction and has also been frequently referred to as the Opioid Cost Calculator.
This latest iteration builds on the previous versions and is release 3.0. We have renamed the tool to reflect our project’s evolving ethos – and especially everything we have learned from the people who are using these data to fund lifesaving work.
We created this tool to show how better opioid outcomes would improve every single community’s quality of life. Through a series of conversations with audiences across Virginia, we have learned about the meaningful ways in which people use these data, what worked well about the tool, and where the tool could be improved. The updates address the following feedback:
- Prioritize the lives of those most impacted within the narrative.
- Update the data to latest available numbers.
- Streamline content flow and design.
- Refine our visuals for accuracy and effectiveness.
Below are snapshots of selected new features in this release.


Clearer Language
Understand key concepts in context with tooltips subtly woven throughout our story and visualizations. These explanations also communicate the human-centered guiding principles behind our work.
Clearer Language
Understand key concepts in context with tooltips subtly woven throughout our story and visualizations. These explanations also communicate the human-centered guiding principles behind our work.
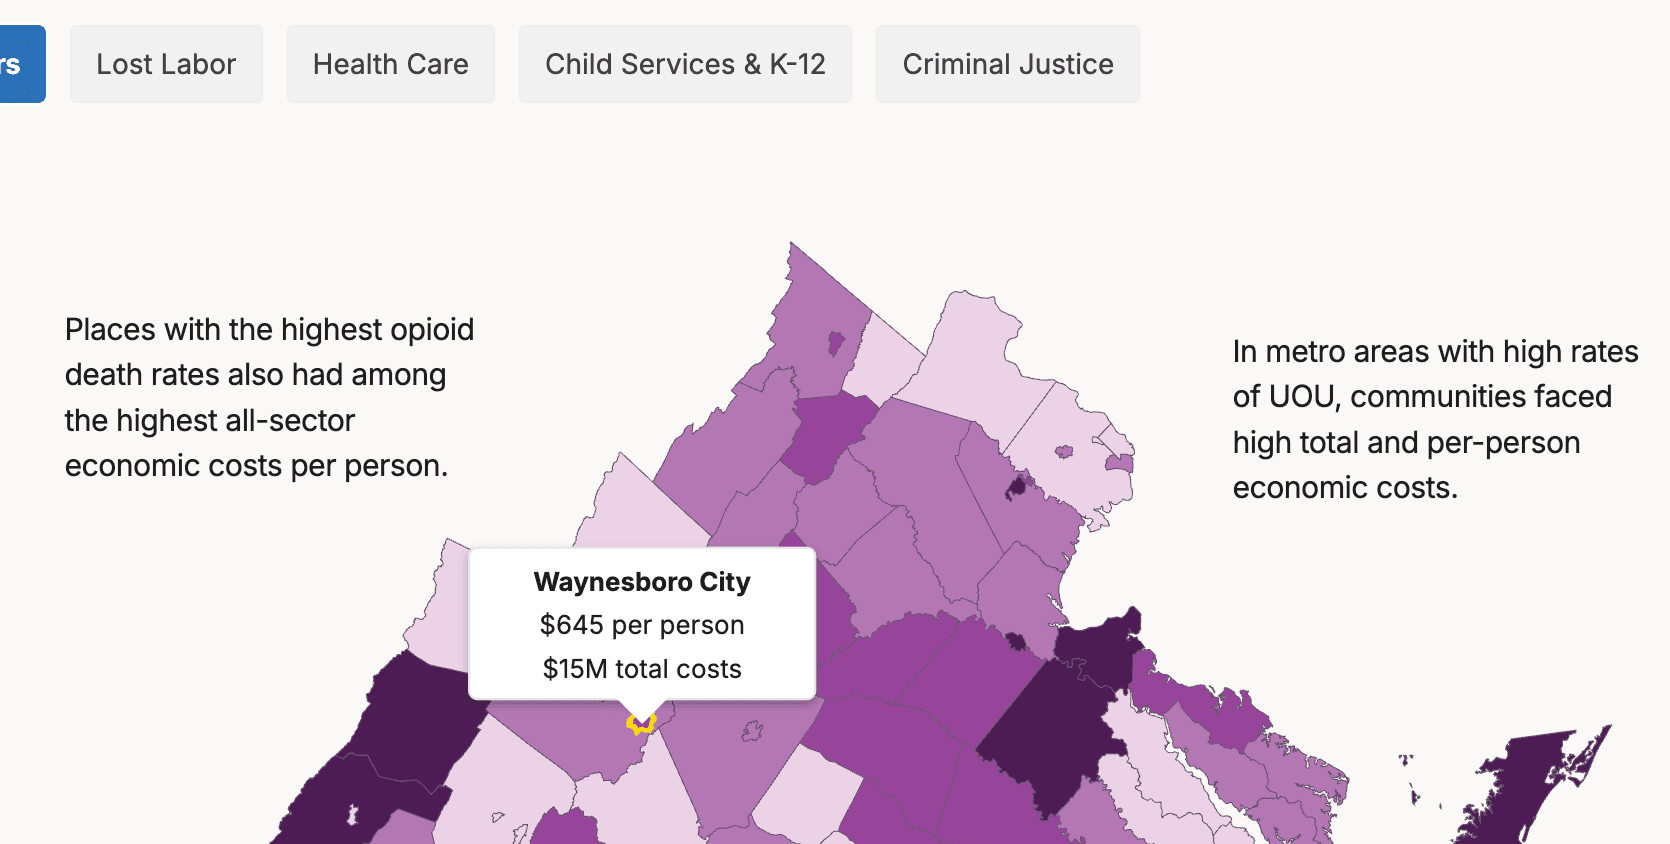
Relevant Context
Find meaningful insights in our new visualizations, with:
- Annotations on the map
- Narrative summary takeaways
- Breakdowns of local cost shares by payer
Relevant Context
Find meaningful insights in our new visualizations, with:
- Annotations on the map
- Narrative summary takeaways
- Breakdowns of local cost shares by payer
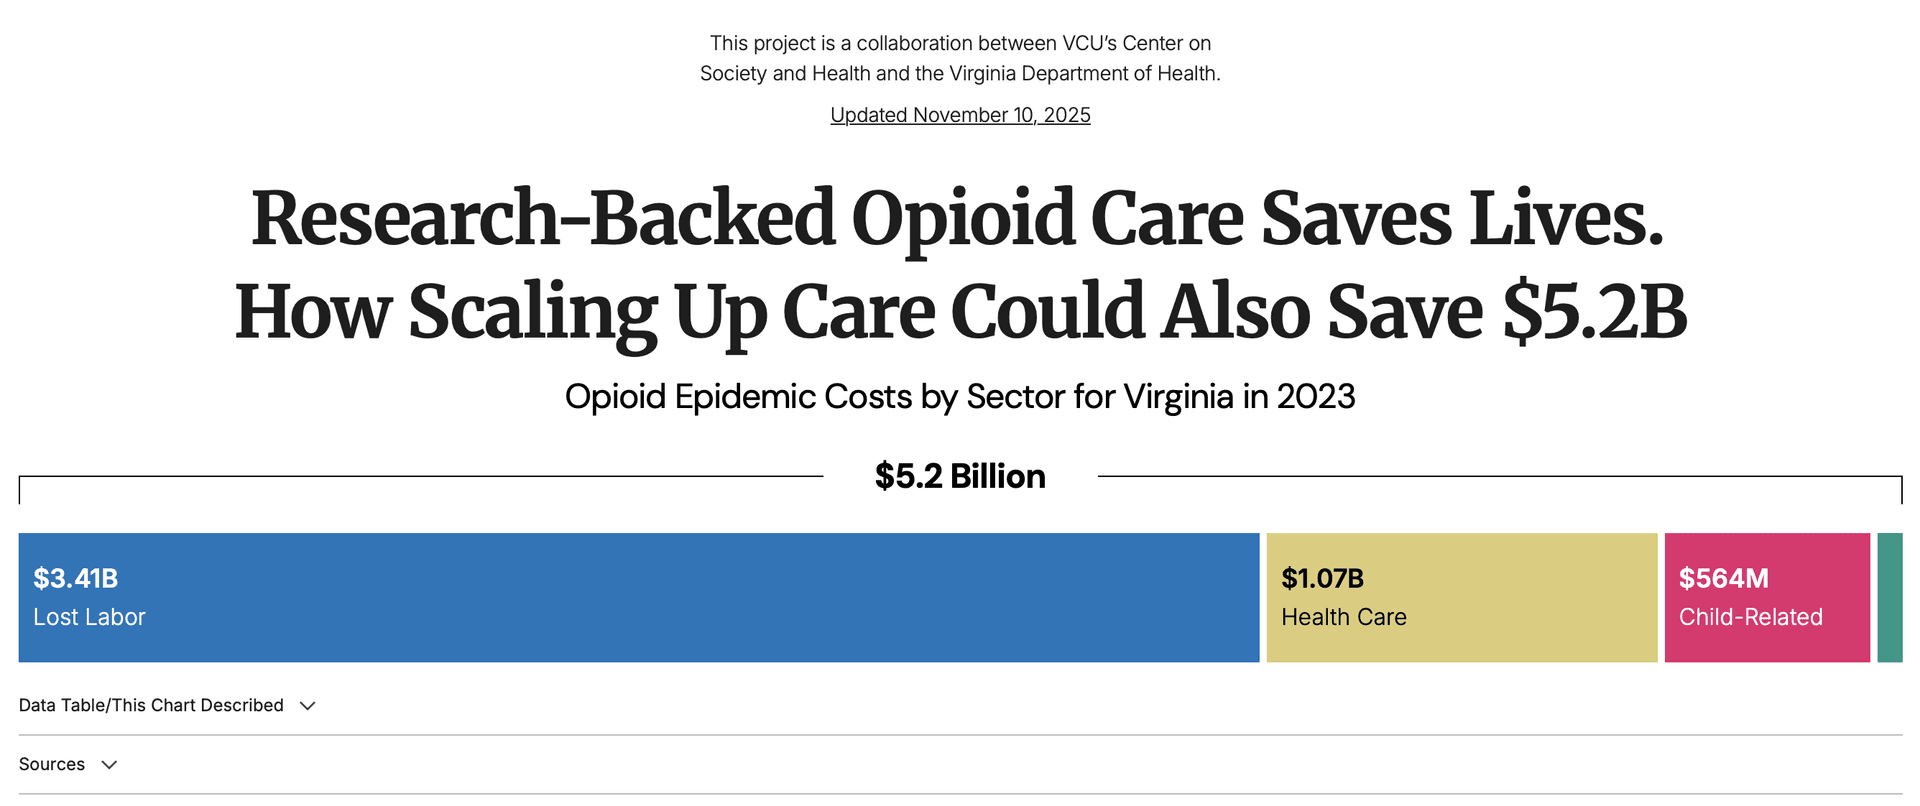
Streamlined Data Visualizations
Conceptualize the big picture at a glance with our simplified and more concise visualizations – without losing key details.
Streamlined Data Visualizations
Conceptualize the big picture at a glance with our simplified and more concise visualizations – without losing key details.
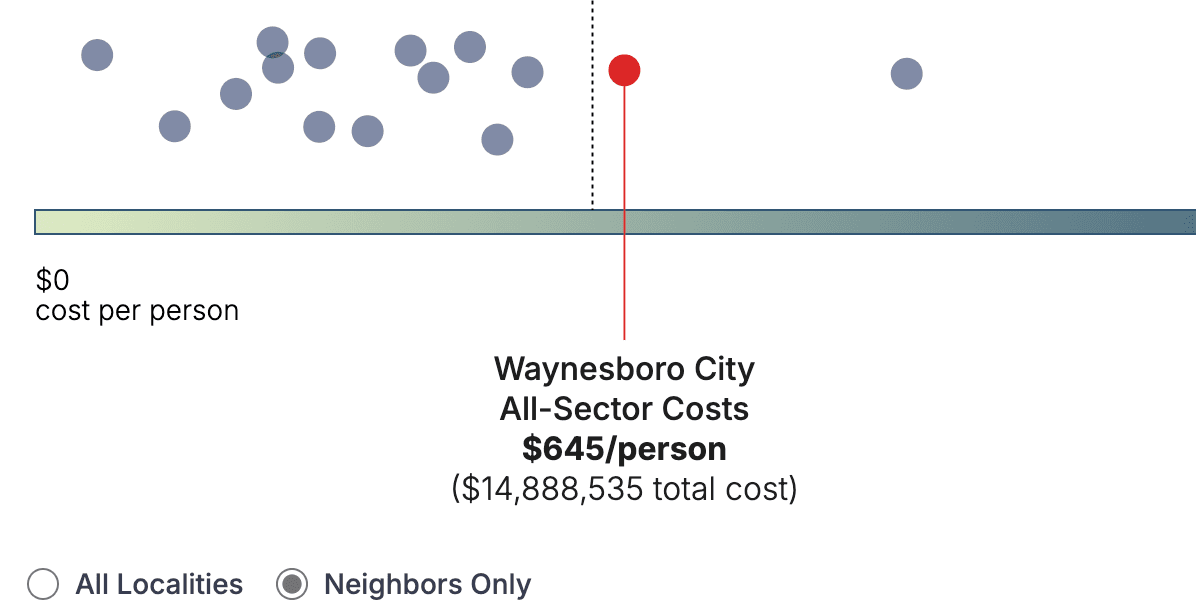
Localized Views
Spotlight your locality and how it compares with neighboring cities and counties.
Localized Views
Spotlight your locality and how it compares with neighboring cities and counties.
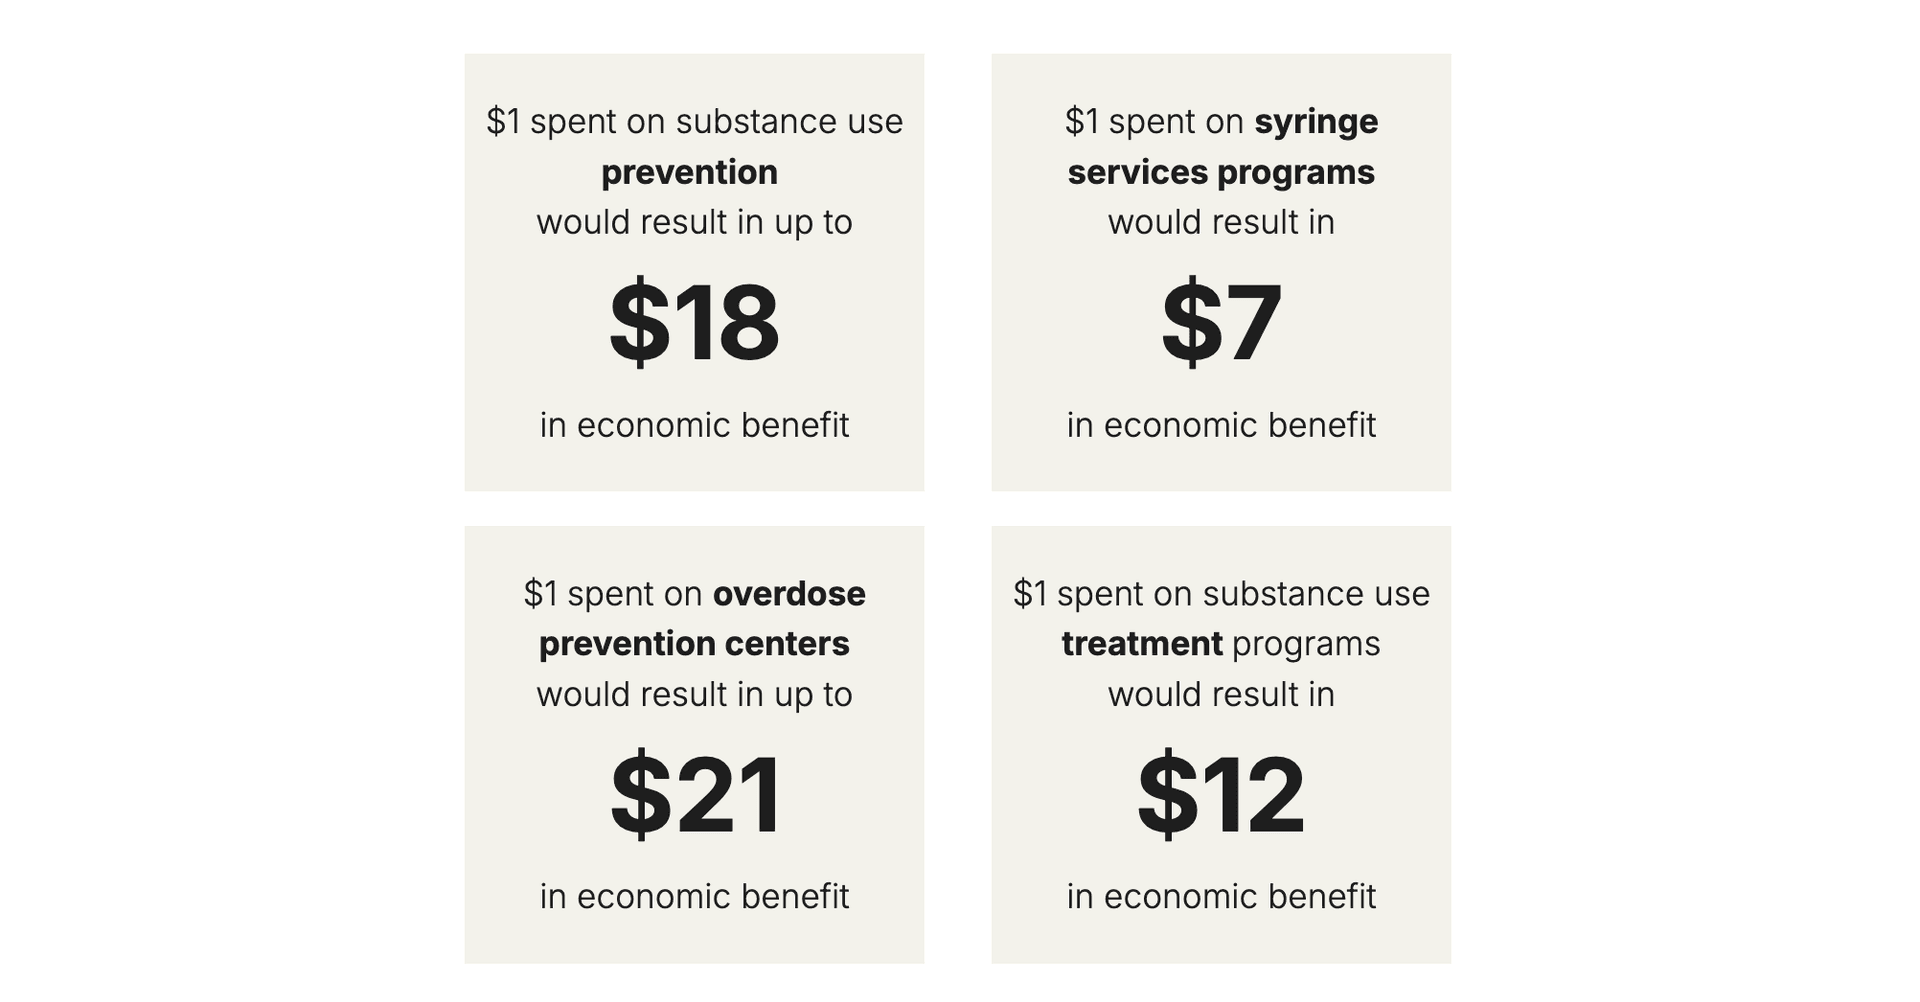
Credible ROI Statistics
Inspire more decision-makers’ support for evidence-based strategies using trusted statistics on economic return on investment (ROI).
Credible ROI Statistics
Inspire more decision-makers’ support for evidence-based strategies using trusted statistics on economic return on investment (ROI).
More Transparency in Methods
Skim our streamlined technical brief for just the basics you need or delve deeper into the document to investigate more complex questions.
More Transparency in Methods
Skim our streamlined technical brief for just the basics you need or delve deeper into the document to investigate more complex questions.
Looking for help with our updated website?
We’d love to hear from you. Want to share insights? See something missing? Want something that isn’t included? We welcome all feedback. Please reach out to us at societyhealth@vcu.edu with any questions or comments. This tool is meant to be for all audiences.